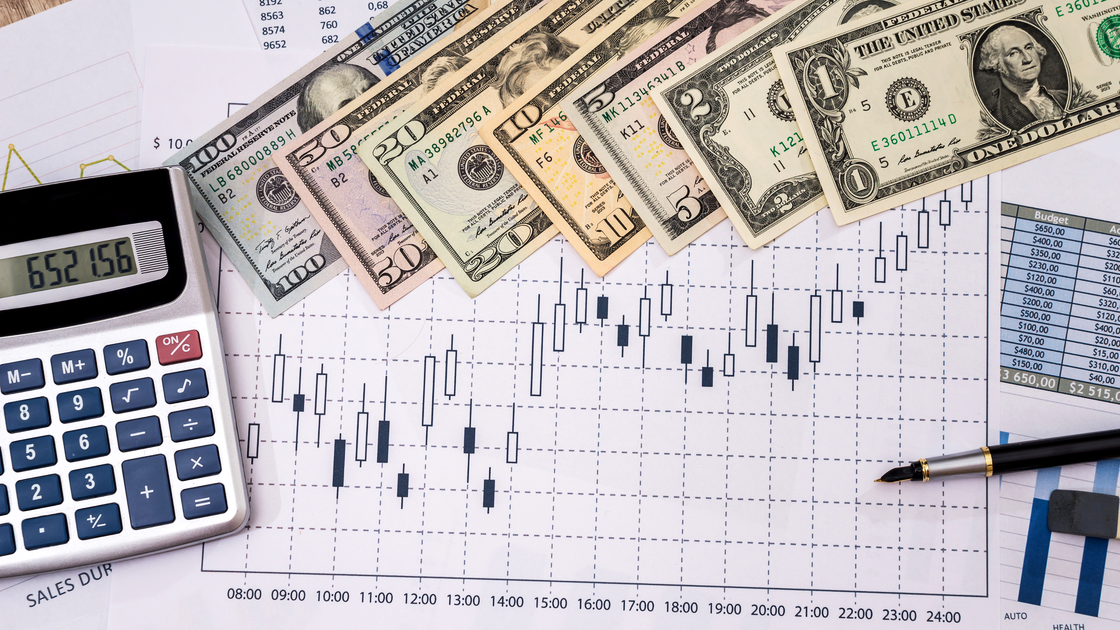
If you want to be successful in the ever-changing corporate world, you must be forward-thinking. Let’s say you have a conversation with a successful Forex trader or investor. They will surely demonstrate their talent and understanding of anticipating the Forex market by evaluating a Forex trend in this scenario. This article was written to assist you in effectively using your FX knowledge by predicting retail investors the changing dynamics of the foreign exchange market.
What is Forex?
Before we go any further, you should read the review of the Australian broker EightCap to understand this topic thoroughly. Simply put, it is a global decentralized currency trading market. It is also the world’s largest marketplace, with daily trades worth trillions of dollars. International banks, hedge funds, commercial firms, numerous central banks, and, of course, retail FX brokers and investors are among the important participants.
Returning to market predictions, we must realize that to be successful, a trader must have a complete understanding of the elements that can influence a currency’s exchange rate. Remember that there is no one-size-fits-all Forex prediction technique; it all depends on your abilities, experiences, foreign exchange forecasting accuracy, and determination to achieve.
What is Technical Analysis?
The technical analysis predicts potential changes in forex price movements by thoroughly evaluating past market data, particularly price data. The patterns created by price changes are referred to as forex signals. The goal of technical analysis is to find the most recent market signals by examining previous forex market indications. This aids traders in determining daily forex predictions and detecting a reversal of a forex trend. Furthermore, prices follow a pattern. Price variations, according to technical experts, are not random or unexpected by nature. Once a trend is established, it is expected to last for a given amount of time.
FX traders can use volume charts, price charts, and other mathematical depictions of market data to find the best entry and exit points for a transaction. Technical analysis improves your trading plan’s discipline and reduces the impact of emotions. Technical analysis provides you with all you need for daily forex analysis and forecast, as well as an objective assessment of your trading strategy.
Now is the time to define the different forms of technical indicators. The trend is the first in the line. Price data is smoothed out with these indicators. The second factor is the trend’s strength. By monitoring the forex market holdings taken by various retail investors, this indicator depicts the market’s intensity on a certain price.
Volume or open interest is the most fundamental strength (power) indicator. Volatility, which relates to the degree of daily price swings, is the next strength. Changes in volatility are expected to be proportional to price changes.
A cycle Forex prediction indicator defines the timing of a specific Forex market pattern. Finally, there’s momentum. These signs show whether a trend will be strong or weak once some time has passed. When a trend starts, it has the most momentum, and when it ends, it has the least.
Linear Tools
Vertical, horizontal, and trend lines are used to illustrate linear technical analytical techniques. Vertical lines serve as a good guide to beginning a new trading session and mark the release of critical news reports. Horizontal lines enable you to focus the trend price medium (support and resistance lines). Breaking these levels is usually a sign of a trend change in the Forex market. Trend lines are useful for determining the recent trend.
Indicators
It is a worldwide tool that allows you to automatically generate numerous lines, waves, and levels on a currency pair chart while also determining essential parameters such as market condition, trend direction, and strength, and even alerting you to an impending reversal.
Indicators are the most valuable instruments for technical analysis. According to professional advice, Moving Average, Bollinger Bands, Stochastic Oscillator, MACD histogram, and RSI are the most effective.
Let’s have a look at how the Stochastic Oscillator works as an example. It consists of two curving lines that travel up and down within the vertical scale from 0 to 100%: the %K line (solid one) and the %D line (dashed one). Below and beyond levels 20 and 80, there are two horizontal levels with oversold and overbought zones, respectively.
The intersection of the %K and %D lines is the primary signal to join the market. So, if the solid line passes the dashed line from the bottom-up approach, you should place a buy order, and if it crosses from top to bottom, you should put a sell order. The %K line has crossed the %D line from top to bottom in the chart below, which is an ideal indicator to begin a short position.
It’s the most basic example of how to use indicators. There are several signals and applications for each of them. Before putting them into practice, we urge that you understand how to implement them.
Technical Analysis Patterns
Technical analysis patterns, often known as chart patterns, allow you to assess and enhance your analysis qualitatively. Currency pair charts, as you may be aware, follow distinct trends. As a result, patterns can be used to forecast both the continuance and reversal of a trend.
Ten basic figures of technical analysis are usually used: Triangle, Head and Shoulders, Double Top, Wedge, Triple Bottom, Triple Bottom, Double Bottom, Flag, Rounding Bottom, Pennant, Triangle, Head and Shoulders, Triangle, Head and Shoulders, Triangle, Head and Shoulders, Triangle, Head and Shoulders, Triangle, Head and Shoulders, Triangle, Head and Should There are restrictions for joining the market for each of them.
Let’s take Triple Top as an example. The Triple Top is a technical analysis figure that appears after an extended advance in financial markets, particularly the Forex market, and suggests a likely trend reversal.
The model is considered complete when the price goes below the support level (a certain variance is permissible). When a sell signal arises, the trend is predicted to shift. As you can see, the technical analysis offers various approaches for putting its instruments to work and predicting price fluctuations.